What Your WordPress Access Log Shows That Analytics Hides

Open Google Analytics and your site had 400 visitors last month. Open your WordPress access log and the server handled 90,000 requests and 40 GB of bandwidth. Both numbers are correct. They are counting different things, and the gap between them is where every problem you did not know you had is currently living.
Analytics counts people who loaded your pages and ran JavaScript. That is a small, well-behaved subset of what actually reaches your server. Everything else in that gap falls into two groups: machines reading your content, and machines looking for a way in. Neither will ever appear in a dashboard built to measure marketing.
This guide shows you how to see the real traffic, how to tell the three groups apart, and how to run a specific forensic check on your own site using a vulnerability that is being actively exploited right now as the worked example.
The two numbers that never match
Every WordPress site has at least two traffic records:
- The analytics record. Google Analytics, Plausible, Jetpack Stats. These load a JavaScript snippet in the visitor’s browser and report back. No JavaScript, no record.
- The server record. Your access log. Every single request that reached the server, in the order it arrived, whether it was a person, a search engine, a scraper, or a scanner probing for a file that does not exist.
A bot that never executes JavaScript is invisible to the first and fully visible to the second. That is not a flaw in your analytics, it is the design. But it means the dashboard you check every week is structurally incapable of showing you the traffic that costs you money or breaks your site.
Three populations, one server
Split the requests hitting your site into three groups and the log becomes much easier to read.
People. They load a page, then the CSS, the JavaScript, a font or two, and half a dozen images. One human visit is fifteen to fifty log lines clustered in the same second or two, from the same IP, with a browser user agent. This group is the one your analytics reports.
Crawlers. Search engines, feed readers, preview generators, and increasingly AI training and retrieval bots. They request HTML and usually skip the assets. One crawler will work through your sitemap methodically: page, pause, next page, pause. The polite ones identify themselves in the user agent. They cost you bandwidth and CPU, and if they are aggressive enough they cost you real money on a metered host.
Scanners. These request things you do not have. /wp-content/plugins/some-plugin/readme.txt, /.env, /wp-config.php.bak, /xmlrpc.php. They are fingerprinting: working out which plugins you run and which versions, so a known vulnerability can be matched against your site. A scanner request that returns 404 is a miss. One that returns 200 told the attacker something.
The third group is small in volume and the only one that can take your site away from you.
Where your WordPress access log lives
You do not need to be a system administrator to read this, but you do need to find it. Depending on your host:
- cPanel: Metrics, then Raw Access. Download the current log, or turn on archiving so you keep more than the current day.
- Plesk: Websites & Domains, then Logs.
- Managed WordPress hosts (Kinsta, WP Engine, SiteGround, Cloudways): look for an Access Logs or Logs panel in the site dashboard. Most keep somewhere between 24 hours and 30 days.
- Cloudflare in front of your site: the Security Events and Analytics tabs show what Cloudflare handled before it ever reached your host. This is the view most people have never opened.
Two things to do before you need this. First, check your retention. A log that only covers the last 24 hours is useless for answering “was I hit three weeks ago”. If your host lets you extend it, extend it. Second, if you use Cloudflare or any other proxy, confirm your server is recording the real visitor IP and not Cloudflare’s, or every line in your log will look like it came from the same handful of addresses.
Reading one line
Access logs are almost always in the combined format. One request, one line:
203.0.113.45 - - [12/Sep/2026:14:22:09 +0000] "GET /contact/ HTTP/1.1" 200 18422 "https://google.com/" "Mozilla/5.0 (Windows NT 10.0; Win64; x64)..."Left to right, that is: who asked, when, what they asked for, what you answered, how many bytes you sent, where they came from, and what they claimed to be. The two fields that matter most for this exercise are the request and the status code.
The status code is the part people skip, and it is the part that tells you whether something worked:
- 200 means you served it. For a normal page that is fine. For a file an attacker uploaded, it means the file ran.
- 404 means it was not there. A wall of 404s from one IP is a scanner failing, which is the outcome you want.
- 403 means something blocked it, usually a firewall rule.
- 301 and 302 are redirects, normal.
- 500 means your site broke serving it. A cluster of these is worth investigating on its own.
One more note on the user agent field: it is self-reported and trivially faked. A line claiming to be Googlebot may or may not be Googlebot. Treat it as a hint, never as identification.
Searching a log that is too big to read
A month of traffic on a modest site is hundreds of thousands of lines. You are never going to read that, and you do not need to. You need to answer specific questions, and every question here is a search.
If your host gives you SSH, three commands do almost all of the work. Count how many times something appears:
grep -c "elementor_pro_forms_send_form" access.logSee the actual lines, with the status code:
grep "uploads/elementor/forms" access.log | grep "\.php"Find the busiest IP addresses, which is how you spot one machine generating a disproportionate share of your traffic:
awk '{print $1}' access.log | sort | uniq -c | sort -rn | head -20That last one is worth running even when nothing is wrong. On a healthy site the top entries are search engine crawlers and your own uptime monitor. If a single address you do not recognise is pulling ten times more than anything else, you have found your bandwidth question in one line.
No SSH is not a blocker. Download the log through your host’s file manager and open it in any editor that handles large files, then use find-in-file for the same strings. The search terms are what matter, not the tool. If your log arrives gzipped, most editors will open it after you extract it, and on the command line zgrep searches the compressed file directly.
One practical warning: do not search for an IP address you found and then block it in isolation. Scanner traffic rotates addresses constantly, so blocking one is at best a few minutes of quiet. The useful output of a log search is the pattern and the timestamp, not a list of addresses to ban.
Population two: the crawlers on your bandwidth bill
AI crawlers changed the shape of this problem. A search engine crawls you because it wants to send you visitors. A training crawler takes your content and sends you nothing. A retrieval crawler fetching pages to answer someone’s question may send a citation, which is worth something, but it is still bandwidth you are paying for.
The volume is not theoretical. Site owners regularly report tens of thousands of AI bot requests in a month against sites that get a few hundred human visitors, which is a ratio that will show up on a metered hosting plan long before it shows up anywhere else.
Three things are worth knowing here.
robots.txt is a request, not a control. Well-behaved crawlers honour it. Anything that ignores it faces no consequence, because robots.txt is served to the crawler and enforced by the crawler. If you want a control, it has to run before the request reaches your PHP.
The edge is where you enforce. If you run Cloudflare, its bot controls and the AI Crawlers toggle do the blocking before your server spends any resources. If you do not, your options are your host’s firewall or a security plugin, and the plugin one costs you a full WordPress boot on every blocked request, which partly defeats the purpose.
Blocking is not automatically the right call. If people are asking AI assistants questions your site answers, being in those answers is worth more than the bandwidth. The useful distinction is between crawlers that cite you and crawlers that only take, and between a crawl rate you can afford and one you cannot. Decide deliberately rather than blocking everything by reflex.
Verifying a crawler is who it claims to be
Because the user agent is self-reported, a line reading Googlebot or GPTBot proves nothing on its own. Scrapers routinely borrow those names precisely because site owners allowlist them, and because blocking something that says Googlebot feels risky.
There are two ways to check. The major crawler operators publish the IP ranges their bots use, as machine-readable lists, so you can confirm that a request claiming to be a given bot actually came from that operator’s network. The older method is a reverse DNS lookup on the IP, which should resolve to a hostname on the operator’s own domain, followed by a forward lookup on that hostname to confirm it points back to the same IP. One direction alone is forgeable, both together are not.
You do not need to do this for every line. Do it once, for whichever claimed crawler is generating the most requests, before you decide whether to allow it or block it. A bot that fails the check is not a crawler with a bandwidth cost, it is a scraper wearing a costume, and the decision about it is a much easier one.
For the technical detail on blocking specific crawlers at each layer, we covered that separately in the complete guide to blocking AI crawlers. Worth reading alongside this, because impersonation is now common enough that a user agent claiming to be a well-known AI bot deserves verification before you trust it.
Population three: the scanners
Scanner traffic looks nothing like a visit. Watch for:
- Many requests from one IP in a short window, almost all 404.
- Requests for plugin and theme files you do not have installed.
- Requests for
readme.txtandchangelog.txtinside plugin folders. These leak version numbers, which is exactly what a scanner wants. - POST requests to
/wp-login.phpor/xmlrpc.phpin volume. - POST requests to
/wp-admin/admin-ajax.phpfrom an IP that never loaded a page first. Legitimate AJAX comes after a page view. AJAX with no page view before it is a script talking directly to an endpoint.
That last one matters more than it used to, because a large share of WordPress vulnerabilities are reachable through admin-ajax.php without ever logging in. Which brings us to a live example.
A worked example you can run on your own site
In August 2026, Patchstack published a critical unauthenticated file upload flaw in Elementor Pro, tracked as CVE-2026-32475 with a CVSS score of 9.0. It affects version 4.2.1 and below, and it is fixed in 4.2.2. In September, Wordfence reported that attackers were actively exploiting it.
Every advisory tells you to update. Almost none tell you how to check whether you were hit in the window between the flaw becoming public and you applying the update. That window is the entire problem, and on most sites it was days or weeks long.
Here is what makes this one checkable.
The ingredient
The flaw is in the Forms module’s File Upload field. To be exposed, your site needed a published Elementor page containing a Form widget with a File Upload field on it. That is an ordinary configuration, not an exotic one: job application forms, “attach a photo of the damage” forms, support tickets with attachments. If you never built a form with a file upload, you were not exposed through this particular path.
The reason it is worth checking anyway is that the upload lands in a fixed, predictable location, which means you can look.
Step one: are you patched
Plugins, find Elementor Pro, read the version. Anything at 4.2.2 or above is fixed. Anything below it, update now, before you do anything else in this list. If you are on a maintenance plan and someone else handles updates, ask them for the version number rather than assuming.
Step two: look in the upload directory
Successful exploitation writes a PHP file into wp-content/uploads/elementor/forms/. That folder is where legitimate form attachments go, so it may well have files in it. What it should never have is a .php file.
Using your host’s file manager or SFTP, open that folder and sort by type or by date. Legitimate contents are the documents and images people actually submitted through your forms. Any file ending in .php there is not something your site put there. The filenames generated by this flaw are 13 hexadecimal characters, so you are looking for something like 68c1f0a2b3c4d.php rather than a recognisable name.
If you find one, stop and skip to the last section. Do not open it in a browser.
Step three: search the access log
Two patterns, in this order.
First, the delivery. Search your log for elementor_pro_forms_send_form. This is the AJAX action the form submission uses, and it appears as a POST to admin-ajax.php. Genuine submissions look like a person: the same IP loaded the page with the form on it first, and there is usually one submission, not forty. A burst of these from an IP that never requested the page is the signature worth flagging.
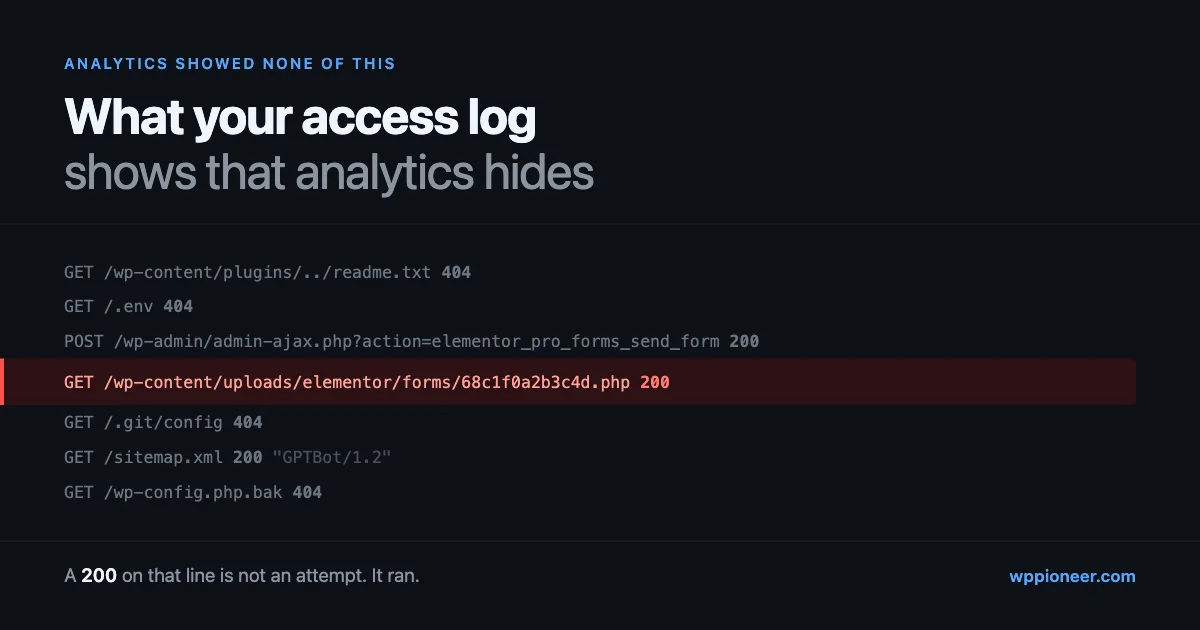
Second, and far more important, the execution. Search for requests to /wp-content/uploads/elementor/forms/ that end in .php, and look at the status code:
GET /wp-content/uploads/elementor/forms/68c1f0a2b3c4d.php HTTP/1.1" 404A 404 means someone guessed at a filename and there was nothing there. A 200 means the file existed and your server ran it. That is the line that separates an attempt from a compromise, and it is the single most valuable thing in this entire article. Write down the date, the IP, and the filename.
Step four: check the form notification mailbox
This one is easy to miss. Elementor’s default form notification email uses an [all-fields] tag that renders every submitted field, including the URL of any uploaded file. If your forms email you on submission, your inbox is an unintentional audit log.
Search that mailbox for messages containing /uploads/elementor/forms/ and a .php extension. A notification email pointing at a PHP file is direct evidence, with a timestamp, of exactly when it happened. It also works when your host has already rotated the access log away.
Why nothing warned you
Three systems that feel like they are watching all had a reason not to tell you.
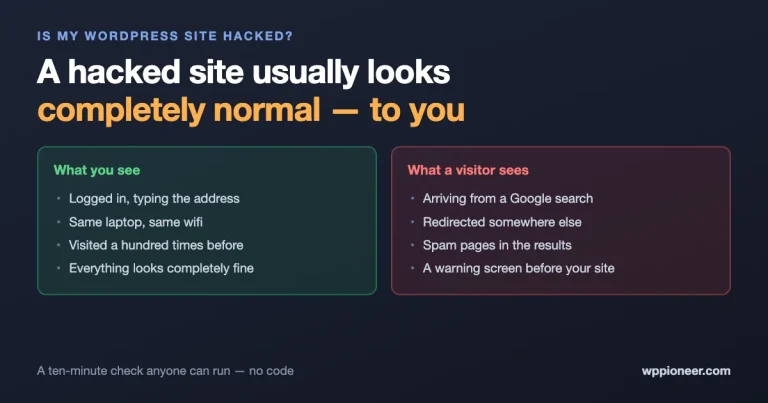
Analytics never saw it. None of this traffic runs JavaScript. It is not a gap in your setup, it is the boundary of what analytics measures.
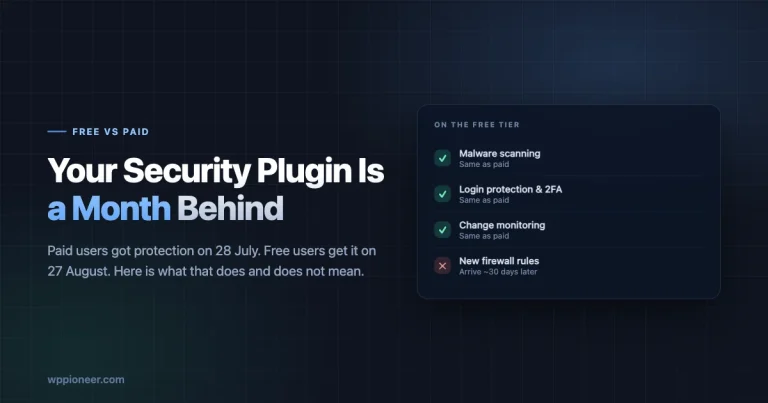
Your security plugin was probably late. Free tiers of the major security plugins delay new firewall rules, commonly by 30 days, with real-time rules reserved for paid plans. The gap between a flaw going public and your free plugin learning to block it is precisely the window attackers work in. We wrote about that timing problem in Your Security Plugin Is Protecting You a Month Late, and this vulnerability is exactly the scenario it describes.
Your uptime monitor checks the homepage. A PHP file sitting in your uploads folder does not take your homepage down. It does not need to. Uptime monitoring answers “is the site responding”, not “is the site still only running my code”.
What to change this week
None of this requires a developer.
- Find your WordPress access log and extend its retention. If you can only see the last 24 hours, you cannot investigate anything. This is a settings change on most hosts.
- Open it once while nothing is wrong. Ten minutes reading a normal week teaches you what normal looks like, which is the only way abnormal becomes obvious later.
- Compare your analytics number to your host’s bandwidth number. If the gap is large, you have a crawler question to answer, and it is a cost question before it is a security question.
- Check the version of every plugin that accepts input from logged-out visitors. Forms, comments, search, booking, file upload. That is your actual exposed surface, and it is much smaller than your full plugin list.
- Decide who applies security updates and how fast. “Whenever someone logs in and notices” is the setting that turns a public advisory into an incident.
For the broader routine, our monthly WordPress security audit checklist covers the surrounding ground, and automated backups that actually work is the thing you will wish you had set up before you needed it.
If you found something
A PHP file in your uploads folder, or a 200 on one, means you are past the point where reading logs helps. Do not delete the file and assume it is over. Whatever ran had the same permissions as WordPress, which means it had time to add an administrator account, write a second file somewhere else, or schedule itself to come back.
Work through how to tell if your WordPress site was hacked, and what to do first, then how to fix a hacked WordPress site without losing your content. Keep the file and the log lines. If you bring in help, those are the first things they will ask for.
And if the checks came back clean, you have not wasted your time. You now know where your log lives, what your normal looks like, and which of your plugins actually face the open internet. That is the position you want to be in the next time an advisory lands, because there will be a next time, and the window between public and patched is the only part of it you control.