Speed Up WordPress Fast: The Complete Core Web Vitals Guide 2026

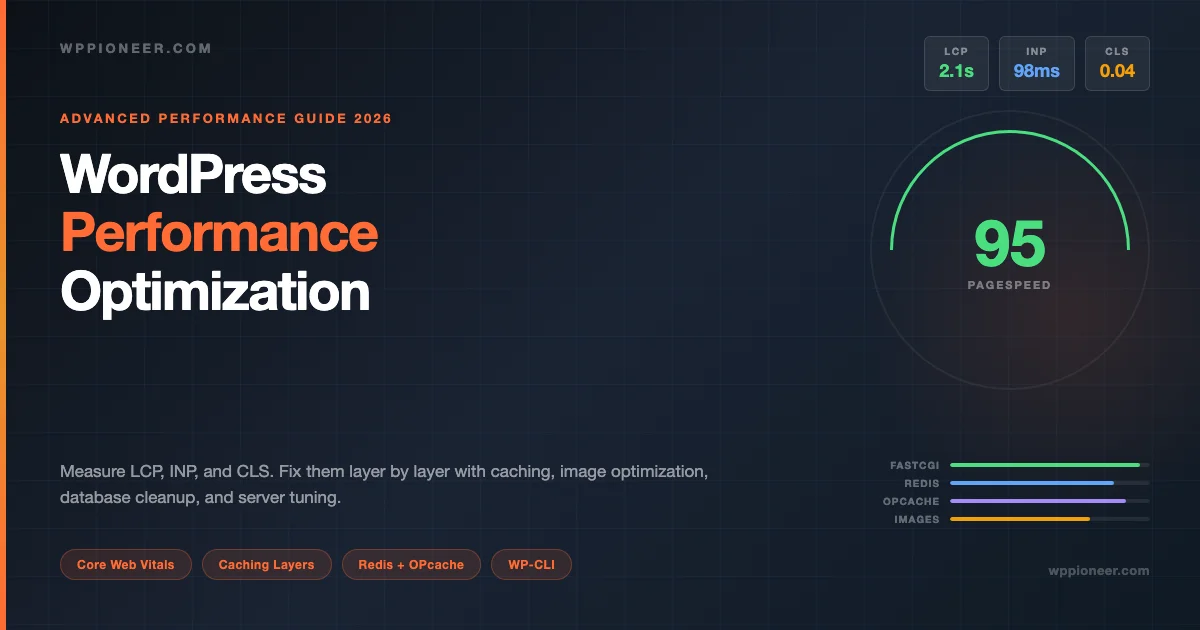
Your WordPress site’s Google rankings are now tied directly to how fast it loads. Since 2021, Core Web Vitals have been a confirmed Google ranking factor, and most WordPress sites fail at least one of the three metrics right out of the box. This guide gives you the full picture: how to measure where you actually stand, what is slowing you down, and how to fix it layer by layer, from PHP settings to CDN configuration to image format choices.
Understanding Core Web Vitals in the WordPress Context
Core Web Vitals are three user-experience metrics that Google uses to measure page quality. They are not theoretical benchmarks. They come from real user data collected in Chrome (the CrUX dataset). That distinction matters: a page can score 90 in Lighthouse but perform worse in the field because real users are on mobile networks with poor connections.
LCP: Largest Contentful Paint
LCP measures how quickly the largest visible element (usually your hero image or above-the-fold heading) renders. Google’s threshold: good is under 2.5 seconds; needs improvement is 2.5-4s; poor is above 4s. On most WordPress sites, the LCP element is the featured image. If it is not preloaded, if it is not sized correctly, or if the server takes over 1 second to respond with the first byte (TTFB), you will fail LCP regardless of everything else you do.
INP: Interaction to Next Paint
INP replaced FID (First Input Delay) as a Core Web Vital in March 2024. It measures responsiveness to all user interactions throughout the page lifecycle, not just the first click. Good INP is under 200ms. Poor is above 500ms. On WordPress, the biggest INP killers are bloated JavaScript bundles that block the main thread and third-party scripts (analytics, chat widgets, ad networks) that fire on every interaction.
CLS: Cumulative Layout Shift
CLS captures unexpected visual shifts, elements jumping around as the page loads. The classic WordPress offenders: images without explicit width/height attributes, embeds (YouTube, Google Maps) loading after text, and web fonts causing a flash of unstyled text (FOUT) that pushes content down. Good CLS is under 0.1; poor is above 0.25.
Measuring First: Tools and What They Actually Tell You
Do not skip this phase. Every fix without data is a guess. Run these tools in order and document your baseline before touching anything.
PageSpeed Insights and CrUX Data
Go to pagespeed.web.dev and enter your URL. The key section is “Discover what your real users are experiencing” at the top. That is CrUX data from the last 28 days of real Chrome users. The Lighthouse score below it is a lab test run from a single US server. Both matter, but field data (CrUX) is what Google uses for ranking.
Pay attention to which specific URL you test. The homepage and a blog post can have very different scores. Test at least three pages: homepage, a content-heavy post, and your most-visited page from Google Analytics.
Chrome DevTools: Network and Performance Panels
Open DevTools (F12), go to Network, check “Disable cache” and set throttling to “Fast 4G.” Reload. Look at: waterfall order (are CSS and JS blocking render?), TTFB for the first HTML document, and which resource is the largest paint candidate. In the Performance panel, record a page load and look for Long Tasks. Any task over 50ms is a candidate for INP problems.
Query Monitor: Your WordPress-Specific Profiler
Query Monitor is a free plugin that shows you database query counts, query times, HTTP API calls, hook timings, and PHP errors. All of this is broken down by which plugin or theme fired each one. Install it on a staging copy (never profile on production while users are active). The two columns to watch first are “Total Queries” and “Query Time.” A healthy WordPress page should run under 50 queries and under 50ms of total query time. If you are seeing 200+ queries or 500ms+ query time, the Database section will tell you exactly which query is slow and which plugin called it.
The slow query finder in Query Monitor works without enabling MySQL’s slow query log. Here is the MySQL query you would run if you wanted to cross-reference at the database level:
The WordPress Performance Lab Plugin
The WordPress Performance Team ships experimental improvements through the Performance Lab plugin before they land in core. As of 2026, it includes several modules you can enable independently:
- Speculative Loading: Prefetches pages when a user hovers over a link, so the next page feels instant. Uses the browser’s Speculation Rules API. Only works in Chrome-based browsers but degrades gracefully. Enable this first. It requires zero configuration and has a visible effect on perceived navigation speed.
- Modern Image Formats: Converts JPEG and PNG uploads to WebP and AVIF automatically at upload time. AVIF is 50% smaller than WebP at equivalent visual quality. The module adds fallbacks for browsers that don’t support AVIF.
- Fetchpriority: Adds fetchpriority=”high” to the LCP image candidate (usually the featured image) so the browser downloads it before lower-priority resources. This is one of the highest-ROI single changes for LCP.
- Image Loading Optimization: Sets loading=”lazy” on below-the-fold images automatically and removes it from above-the-fold images where eager loading is better.
- Embed Optimizer: Lazy-loads YouTube, Vimeo, and other embeds by default, replacing them with a lightweight placeholder until the user interacts. Eliminates the major CLS issue that iframes cause.
The plugin is modular. You turn on only what your site needs. Start with Speculative Loading and Fetchpriority. If you already use a full-featured caching plugin that handles image optimization, skip the Modern Image Formats module to avoid double processing.
Caching Layers: Page Cache vs Object Cache vs OPcache
Most guides treat caching as “install WP Rocket and you’re done.” That works at a surface level, but understanding what each caching layer actually does lets you stack them correctly and avoid the misconfiguration that causes more problems than the one you solved.
Page Cache: The First Line of Defense
Page caching stores the fully rendered HTML of a page as a static file. When the next visitor requests that URL, the server returns the pre-built HTML without executing PHP or hitting the database at all. TTFB drops from 400-800ms to under 50ms. This is the single biggest performance win available to most WordPress sites.
Plugin options: WP Super Cache (free, simple), W3 Total Cache (free, complex), WP Rocket (paid, best DX). For managed hosting (WP Engine, Kinsta, Cloudways), the host’s built-in page cache is almost always faster than a plugin-level solution. Disable the plugin-level page cache if your host provides one to avoid conflicts.
What page cache doesn’t fix: Logged-in users always bypass page cache. WooCommerce cart and checkout pages must be excluded from cache. Admin pages are never cached. If 80% of your traffic is logged-in users (membership sites, LMS platforms), page caching has limited impact.
Object Cache: Redis and Memcached
WordPress has a built-in object cache, but by default it is an in-memory cache that dies at the end of each PHP request. It never persists between page loads. A persistent object cache (Redis or Memcached) stores the results of expensive database queries across requests. The impact is most visible on sites that run complex queries: membership platforms, WooCommerce stores with large product catalogs, and sites using plugins that fire many queries per page.
Redis is the recommended choice in 2026. It supports more data structures than Memcached, has better client libraries, and most managed hosts that offer object caching use Redis. We covered the full Redis setup process in our Redis Object Cache setup guide. The short version is that you need the Redis server, the PHP extension, and the Redis Object Cache plugin. The setup script:
OPcache: PHP Bytecode Cache
OPcache is a PHP extension (enabled by default in PHP 7.4+) that caches compiled PHP bytecode in memory. Without OPcache, PHP reads your source files from disk, parses them, and compiles them to bytecode on every request. With OPcache, that compiled bytecode is cached in RAM. Subsequent requests skip the compile step entirely. On a typical WordPress site, OPcache reduces PHP processing time by 30-50%.
Check if it is active with php -m | grep -i opcache at the command line. Key settings in php.ini to tune:
| Setting | Recommended Value | What It Does |
|---|---|---|
| opcache.enable | 1 | Enable OPcache |
| opcache.memory_consumption | 256 | MB of shared memory for cached bytecode |
| opcache.max_accelerated_files | 10000 | Max files to cache (set high for large WP installs) |
| opcache.validate_timestamps | 0 (production) | Skip checking file modification time. Faster, but requires manual reset on deploys. |
| opcache.revalidate_freq | 60 | Seconds between file modification checks (when validate_timestamps=1) |
Set opcache.validate_timestamps=0 on production only. If you deploy code and OPcache doesn’t clear, users will see the old version. Your deployment script should clear the bytecode cache after every deploy.
Server-Level Cache: Nginx FastCGI Cache and Varnish
Nginx FastCGI cache operates at the web server level, below PHP entirely. It stores cached responses on disk and serves them without starting a PHP-FPM process. The performance difference vs plugin-level page cache: TTFB drops to 5-20ms (compared to 30-100ms with a plugin). The trade-off is configuration complexity. You need server access and the cache bypass rules must be written carefully or you will serve cached pages to logged-in users.
Here is the core Nginx config for WordPress FastCGI caching:
Varnish is an HTTP accelerator that sits in front of your web server. It is more powerful than Nginx’s built-in cache for complex caching rules, but adds infrastructure complexity. On shared or managed hosting you will not have access to either. The host’s caching layer handles this for you.
Asset Optimization: JavaScript, CSS, and Fonts
Eliminating Render-Blocking Resources
A render-blocking resource is any CSS or JavaScript file in the HTML head section that the browser must download and process before it can render anything on screen. WordPress themes and plugins are particularly bad at this. Many enqueue scripts and styles unconditionally, even on pages where they are not used.
To find render-blocking resources: run Lighthouse and look at the “Eliminate render-blocking resources” opportunity. It will list each resource and how many milliseconds it is delaying first render. For JS: anything not needed for above-the-fold content should have a defer or async attribute. For CSS: anything not needed above the fold should be loaded asynchronously.
The correct approach for CSS: extract the critical above-the-fold CSS, inline it in the head, and defer the full stylesheet. Here is a practical WordPress implementation:
Be honest about the scope here: extracting critical CSS properly requires tooling (Penthouse, Critical, or criticalcss.com). The snippet above is the WordPress-side implementation. You still need to generate the critical.css file for your specific theme and pages.
Deferring and Delaying JavaScript
WordPress registers scripts via wp_enqueue_script() with an optional $in_footer parameter. Scripts registered in the footer still block page parsing in some browsers. The performance-correct approach is to add defer to non-critical scripts via the script_loader_tag filter. Plugins like WP Rocket and Asset CleanUp handle this via a GUI.
The distinction between defer and async matters: defer downloads in parallel but executes in order after HTML parsing; async executes immediately when downloaded, in any order. For WordPress scripts that depend on jQuery, always use defer, never async, or jQuery will not be available when dependent scripts run.
The most impactful optimization is often removing scripts entirely from pages that don’t need them. The Asset CleanUp Pro plugin or WP Rocket’s “Load JS Deferred” with per-page exclusions can remove contact form scripts from every page except the contact page, remove Woo scripts from non-shop pages, and so on. A site that fires 30 JavaScript requests on every page load will not be fast regardless of defer/async settings.
Font Loading Performance
Google Fonts are a hidden performance tax. The typical implementation loads a stylesheet from fonts.googleapis.com (blocking, additional DNS lookup) that in turn loads WOFF2 files. The browser may show invisible text (FOIT) or unstyled text (FOUT) until fonts load. On a fresh connection, this adds 400-800ms to perceived load time.
The 2026 best practice: self-host fonts. Download the WOFF2 files, serve them from your own domain, and preload them.
The fastest font is the one you’ve already loaded. For display fonts used only in headings, consider swapping to a system font stack and using the web font only as an enhancement. Many readers never notice the difference.
Add font-display: swap in your font face declarations so browsers show the fallback font while the custom font loads. This eliminates FOIT (invisible text) entirely, though FOUT (text reflow) can still affect CLS. Size the fallback font stack to match your web font’s metrics using a tool like Font Style Matcher to minimize the CLS impact of the swap.
Image Optimization: The Biggest LCP Win
Images are almost always the largest contributor to page weight on WordPress sites. The typical unoptimized blog post loads 1-3MB of images. An optimized version of the same page loads under 200KB. The gap between those two states is the single largest performance opportunity most sites have.
WebP and AVIF: Modern Formats
JPEG and PNG are legacy formats. WebP delivers 25-35% smaller file sizes at equivalent quality. AVIF delivers 50% smaller sizes. WordPress 5.8+ generates WebP thumbnails natively (when the server has the required GD or Imagick library). AVIF support landed in WordPress 6.5.
The recommended setup: use a plugin (Imagify, ShortPixel, or Smush) to bulk-convert existing media and auto-convert new uploads. Enable both WebP and AVIF. The plugin will serve AVIF to browsers that support it (Chrome, Firefox, Edge) and WebP or JPEG as fallbacks. Do not try to maintain separate image files manually; let the plugin handle format negotiation via the picture element or server-side content negotiation.
Responsive Images and the srcset Attribute
WordPress generates a srcset attribute for every image, listing multiple sizes so the browser can download the version appropriate for the screen width. The problem: many themes register only 2-3 image sizes, and those sizes may not match actual display widths. A site that displays a 400px sidebar image but serves a 1200px version to mobile users is wasting every mobile visitor’s data.
Audit your registered image sizes: in Query Monitor, go to PHP Errors and check for any “scaled” notices. In the WordPress dashboard, go to Settings > Media and review the thumbnail, medium, and large dimensions. For content images displayed at known CSS widths, add a custom size that matches. Use the sizes attribute in your templates to tell the browser at what CSS width each image displays.
Lazy Loading and the LCP Image
WordPress 5.5+ added native lazy loading to all images by default. This is correct for below-the-fold images but wrong for your LCP image. If the featured image gets loading=”lazy”, the browser won’t start downloading it until it is about to enter the viewport. That is exactly the behavior you don’t want for your most important image.
The Performance Lab plugin’s Fetchpriority module handles this automatically. If you’re not using it, filter on wp_get_attachment_image_attributes and set fetchpriority=”high” and remove loading=”lazy” only for the featured image. Do not disable lazy loading globally because it helps all other images load more efficiently.
CDN Integration
A CDN (Content Delivery Network) serves your images and static assets from edge servers geographically close to each visitor. A user in Mumbai fetching your images from a CDN node in Singapore gets them in 20ms instead of 200ms from your US-based server. For image-heavy sites with international traffic, a CDN is the most cost-effective performance investment you can make.
Cloudflare (free tier covers the basics), Bunny CDN (paid, excellent WordPress integration), and Cloudflare R2 with Cloudflare Images are the 2026 go-to options. For a self-managed setup, Cloudflare’s free plan proxies your entire domain and caches static assets automatically. Enable “Cache Everything” page rule for static asset directories.
Database Optimization
WordPress stores almost everything in wp_options and wp_postmeta. Over time, both tables accumulate junk: orphaned metadata, expired transients, plugin settings from uninstalled plugins, and thousands of post revisions that nobody will ever restore.
The Autoload Bloat Problem
The wp_options table has an autoload column. Options with autoload=yes are loaded on every single page request. WordPress pulls them all in one query at bootstrap. When plugins add large data structures (serialized arrays, base64-encoded blobs) to autoloaded options, that single query can return 1-2MB of data that gets deserialized into PHP objects before any of your page logic runs. This is one of the most common causes of high TTFB that is not related to server hardware.
Healthy autoload total: under 1MB. If you are over 1MB, look at the top offenders. Common culprits: Elementor (stores page data in options), Jetpack modules, caching plugins storing large serialized configs, and plugins that were deleted without a proper uninstall (their options stay behind). For plugin-owned options, update the plugin or contact support about moving data out of autoload. For orphaned options from uninstalled plugins, delete them directly. Know what you’re deleting first.
Transients, Revisions, and Orphaned Data
Transients are WordPress’s internal API for temporary data storage in the database. When a persistent object cache (Redis) is active, transients go there instead. Without a persistent cache, transients accumulate in wp_options and WordPress is supposed to clean them up via cron. In practice, sites with broken WP-Cron or high traffic accumulate thousands of stale transient rows.
Post revisions store every saved version of every post. The default is unlimited revisions. A site with 5 years of active publishing can have 50,000 revision rows, all with associated postmeta. Limit revisions in wp-config.php and periodically clean old ones via WP-CLI:
Run the database optimizer after bulk deletions. It reclaims disk space and defragments tables. On large sites, this can reduce table sizes by 30-40% and measurably speed up queries.
The wp-config.php settings that prevent database bloat from accumulating in the first place:
Server and Hosting Level Optimizations
PHP Version: The Easiest Win on the List
PHP 8.3 is consistently 10-15% faster than PHP 8.0 on WordPress workloads, and meaningfully faster than PHP 7.4 (synthetic benchmarks show up to 2-3x; real WordPress workloads typically see 20-50%). If you’re still on PHP 7.x, upgrading is the single highest-ROI change in this entire guide. Check your current PHP version at the command line with php -v, or in WordPress at Tools > Site Health. Most managed hosts offer PHP version switching from the control panel with no downtime.
Caveat: test on staging before switching production. PHP 8.x removed several deprecated functions that older plugins still call. Check your error log after upgrading to a new major version.
HTTP/2 and HTTP/3
HTTP/2 allows multiple requests over a single connection (multiplexing), eliminating the per-connection overhead of HTTP/1.1. HTTP/3 (based on QUIC) goes further. It runs over UDP, not TCP, and handles packet loss better, which matters on mobile connections. Most modern hosting stacks and CDNs support HTTP/2 by default; HTTP/3 support varies but Cloudflare enables it automatically when you proxy your domain.
With HTTP/2, the old advice of bundling all your JS into one file and combining all CSS into one file becomes counterproductive. HTTP/2 handles many small files efficiently. If your caching plugin is set to aggressively concatenate assets, this can actually slow down HTTP/2 clients. Verify what protocol your server uses by checking the response headers with curl.
TTFB and Server Response Time
TTFB (Time to First Byte) is how long the server takes to respond with the first byte of the HTML document. Google considers under 800ms acceptable; under 200ms is good. High TTFB is almost always caused by slow PHP execution (uncached, heavy database queries) or geographic distance (no CDN, server far from visitor).
Diagnose TTFB: in Chrome DevTools Network panel, click the first HTML document request and look at “Waiting (TTFB)” in the timing breakdown. If TTFB is high even with caching enabled, the issue is that cache is not being served. Check your cache bypass rules.
The Measure-Fix-Re-Measure Loop
Performance optimization is not a one-time project. Google’s CrUX data updates monthly. Your site changes as you add new plugins, new themes, new content types. The correct operating cadence is a monthly check, not a one-and-done sprint.
Here is the repeatable loop:
- Baseline: Run PageSpeed Insights on 3-5 representative pages. Record LCP, INP, CLS values and Lighthouse scores. Take screenshots.
- Identify the bottleneck: Use DevTools waterfall to find the LCP candidate and its load time. Use Query Monitor to find slow queries. Check autoload size. Check JavaScript execution time in Performance panel.
- Fix one layer at a time: Start with PHP version if outdated. Then page cache. Then object cache. Then image optimization. Then asset optimization. Fix the biggest bottleneck first, not the easiest.
- Re-measure: After each significant change, re-run PageSpeed Insights and DevTools profiling. Some changes interact negatively. Re-measuring catches regressions before they compound.
- Field data check: After 28 days, check CrUX field data in PageSpeed Insights. Lab scores and field scores can diverge significantly. A fix that improved your Lighthouse score may not show in field data because it only affects desktop users while most of your traffic is mobile.
Realistic Before/After Expectations
| Fix | LCP Impact | INP Impact | CLS Impact | Effort |
|---|---|---|---|---|
| PHP upgrade (7.x to 8.3) | Medium | Medium | None | Low |
| Page cache (plugin-level) | High | None | None | Low |
| Redis object cache | Medium | None | None | Medium |
| Image format (WebP/AVIF) | High | None | Low | Low |
| Fetchpriority on LCP image | High | None | None | Low |
| Remove unused JS | Medium | High | None | Medium |
| Defer non-critical CSS | Medium | None | Low | Medium |
| Explicit image dimensions | None | None | High | Low |
| Self-host fonts + font-display swap | Low | None | Medium | Medium |
| CDN for static assets | Medium | None | None | Low |
| Database cleanup | Low | None | None | Low |
| Nginx FastCGI cache | High | None | None | High |
Common Trade-offs and Pitfalls
Over-caching breaks dynamic content. Aggressive page caching that doesn’t exclude WooCommerce cart pages, membership content, or personalized widgets will serve the wrong content to the wrong user. Always test your cache exclusion rules with a logged-in user and a WooCommerce cart item after configuring caching.
Plugin stacking creates conflicts. Running WP Rocket + W3 Total Cache + LiteSpeed Cache simultaneously causes undefined behavior. Each plugin hooks into the same WordPress filters and overrides each other unpredictably. Pick one comprehensive caching solution and configure it fully rather than stacking multiple partial solutions.
Lazy loading the wrong images hurts LCP. The most common performance regression after “optimization” is adding lazy loading to the hero image or featured image. The browser needs to discover and download the LCP element as early as possible. Lazy loading tells it to wait.
Minification breaks JavaScript sometimes. Most modern JS minifiers handle well-written code correctly, but some plugins use dynamically constructed strings that break under minification. If something breaks after enabling JS minification, use your caching plugin’s exclude list to whitelist the problematic script rather than turning off minification globally.
Building a Fast WordPress Site from the Start
Performance is much easier to build in than to bolt on afterward. If you’re starting a new site or doing a major rebuild, these are the decisions that matter most:
- Hosting: Choose a host that provides PHP 8.3, HTTP/2 or HTTP/3, and a built-in page cache layer. Kinsta, WP Engine, Rocket.net, and Cloudways all meet this bar. Shared hosting on older infrastructure starts you behind.
- Theme: Block themes (FSE) are lighter than classic themes by default, with no legacy jQuery dependency, fewer DOM elements, fewer PHP hooks. GeneratePress and Kadence are well-optimized classic themes; Blocksy, Ollie, and the default Twenty Twenty-Five are good block theme starting points.
- Plugin budget: Every plugin adds PHP execution time and often JS/CSS. A site with 5 well-chosen plugins is faster than a site with 30. Before installing a plugin, check whether the functionality can be achieved with a code snippet instead.
- Development workflow: Set up a local environment where you can profile freely without affecting users. We covered the full local setup with DDEV and Docker in our local development environment guide. Profiling locally with Query Monitor is much faster than staging round-trips.
Frequently Asked Questions
What is the fastest way to improve a WordPress site’s Core Web Vitals?
Start with the Performance Lab plugin (free, zero config for Fetchpriority and Speculative Loading), then enable page caching. Those two changes together typically fix LCP on sites that are currently failing. After that, convert images to WebP/AVIF and audit your JavaScript load order.
Does page speed directly affect Google rankings?
Yes. Core Web Vitals are a confirmed ranking signal since the Page Experience update in 2021. Google is explicit that failing Core Web Vitals puts you at a disadvantage, particularly in competitive SERPs. The impact is most visible on mobile searches because mobile CrUX data is what Google primarily uses for ranking signals.
How do I know if my caching is working?
Check the response headers. Nginx FastCGI cache adds X-FastCGI-Cache: HIT. WP Rocket adds X-WP-Rocket: HIT. Cloudflare adds CF-Cache-Status: HIT. In Chrome DevTools Network panel, click the first HTML document request and look at Response Headers. If you see a cache HIT, caching is working. If you see MISS on every request, the cache is not being served.
Is a high Lighthouse score the same as passing Core Web Vitals?
No. Lighthouse is a synthetic test from a fixed server location; Core Web Vitals in Google Search Console come from real Chrome users. A page can score 95 in Lighthouse and still show “Poor” CLS in the field because Lighthouse doesn’t capture how fonts render for users with different system configurations, or how third-party scripts that fire based on user actions affect INP.
My mobile score is much lower than desktop. Why?
Mobile Lighthouse uses CPU throttling (4x slowdown) and network throttling (Fast 4G). This simulates a mid-range Android device on a typical mobile connection. Sites that load many large images without lazy loading, or run heavy JavaScript bundles, fail this simulation even though they load fine on desktop with a fast connection. Check your WordPress mobile optimization checklist for mobile-specific issues like tap-target sizing, viewport configuration, and mobile-only render-blocking scripts.
What to Do First: A Priority Order
If you are overwhelmed by the scope of this, here is the order that delivers the most impact per hour spent:
- Upgrade to PHP 8.3 if you are below 8.1.
- Install the Performance Lab plugin and enable Fetchpriority and Speculative Loading.
- Enable page caching (WP Rocket, LiteSpeed Cache, or your host’s built-in cache).
- Convert images to WebP/AVIF (Imagify, ShortPixel, or Smush).
- Add explicit width/height to all images in your theme templates (fixes CLS).
- Install Redis object cache if your host supports it.
- Audit autoload size. If over 1MB, identify and clean up the top offenders.
- Run the WP-CLI database cleanup script and set revision limits in wp-config.php.
- Profile JavaScript with DevTools and defer or remove scripts not needed above the fold.
- Set up a CDN for static assets.
Run PageSpeed Insights after each step. Document your before/after numbers. When you’ve exhausted the easy wins, the remaining gains come from server-level changes (FastCGI cache, Nginx config, dedicated hosting) that require more infrastructure access but deliver disproportionate results.
Performance work on a live WordPress site is never done. It’s an ongoing practice of measuring, identifying bottlenecks, and fixing them one layer at a time.