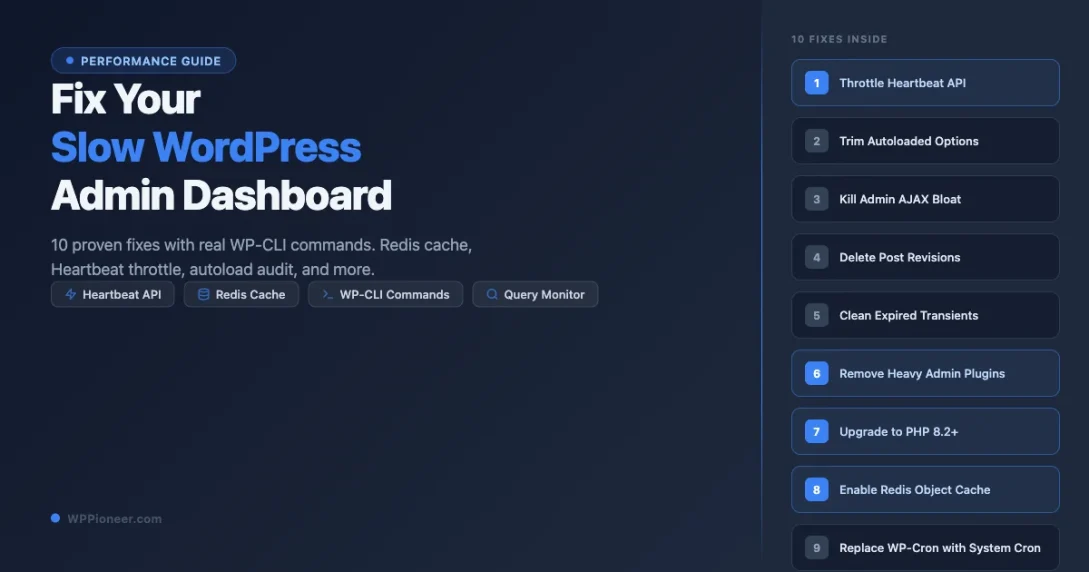
Your WordPress admin dashboard should open in under two seconds. If it takes five, ten, or fifteen seconds to load a single page, you are not imagining it, and the problem is almost certainly fixable without hiring a developer. This guide walks through ten concrete fixes, in order from easiest to most impactful, with real WP-CLI commands for every step so you can run each fix from the command line and see results immediately.
A slow admin panel is more than an annoyance. It slows down content publishing, makes plugin configuration painful, and adds up to hours of lost productivity over weeks. On high-traffic sites, a sluggish admin can also signal database problems that are quietly degrading front-end performance at the same time.
Before you start changing things, it helps to know what is actually slow. The two main culprits are database bloat (too many autoloaded rows, stale transients, thousands of post revisions) and runtime overhead (a polling API hammering the server every few seconds, a heavy plugin loading on every admin page, PHP processing each request from scratch). Most sites have at least three or four of these problems running simultaneously, which is why a single-fix approach often produces disappointing results.
Work through the fixes below one at a time. Each section includes a WP-CLI command you can run from your server over SSH or through your host’s terminal tool. If you want to understand what is making your admin slow before you start fixing it, read through our companion piece on diagnosing a slow WordPress admin panel first, then come back here for the fix-by-fix walkthrough.
Fix 1: Throttle or Disable the WordPress Heartbeat API
The Heartbeat API sends an AJAX request to wp-admin/admin-ajax.php every 15 seconds by default. It keeps autosave working in the editor and handles post locking so two people do not edit the same post at once. On a shared or underpowered server, those continuous requests pile up and visibly slow down every admin page that is open at the same time.
The problem is compounded when multiple browser tabs are open. Four admin tabs means four simultaneous Heartbeat polling loops, each sending a request every 15 seconds. On a server with limited PHP worker threads, this can block real user requests while the server works through a queue of Heartbeat pings.
You have two options: slow the heartbeat down, or turn it off entirely in places where you do not need it.
Option A: Throttle to 60 seconds with a plugin
Install Heartbeat Control by WP Rocket (free, no other WP Rocket features required). Set the frequency to 60 seconds in wp-admin, or disable the heartbeat on the dashboard and frontend while keeping it active at 60 seconds in the post editor. This alone cuts Heartbeat load by 75% with no risk to autosave functionality.
Option B: Disable via a code snippet
Add this to a site-specific plugin or your theme’s functions.php:
// Disable Heartbeat everywhere except the post editor
add_action( 'init', function() {
    global $pagenow;
    if ( $pagenow !== 'post.php' && $pagenow !== 'post-new.php' ) {
        wp_deregister_script('heartbeat');
    }
}, 1 );
Reload any admin page and open your browser’s Network tab (F12, then click Network). You should see the admin-ajax.php calls either stop or slow dramatically. Before the change you would see a call fire every 15 seconds. After, they should be gone from non-editor pages entirely.
On shared hosting plans with limited concurrent connections, this fix alone can cut admin page load times by 30-50% during peak usage hours.
Fix 2: Audit and Trim Autoloaded Options in wp_options
Every time WordPress loads an admin page, it pulls all autoloaded rows from the wp_options table into memory at the start of the bootstrap process. On a clean, freshly installed site this is 200-400 KB. On a site with several years of plugin installs, upgrades, and uninstalls, it can reach 10, 20, or even 80 MB. WordPress reads all of it on every page load, before your theme or plugins even start running.
First, check your current autoload size:
wp db query "SELECT SUM(LENGTH(option_value)) / 1024 / 1024 AS autoload_mb FROM wp_options WHERE autoload='yes';" --allow-root
Anything above 1 MB deserves investigation. Anything above 5 MB is actively hurting your admin load times. To see which options are consuming the most space:
wp db query "SELECT option_name, LENGTH(option_value) AS size_bytes FROM wp_options WHERE autoload='yes' ORDER BY size_bytes DESC LIMIT 20;" --allow-root
Look for options from plugins you have already deleted (their names usually reference the plugin slug), or large serialized arrays that look like cached content or settings. To turn off autoloading for a specific option without deleting it:
wp db query "UPDATE wp_options SET autoload='no' WHERE option_name='name_of_the_option';" --allow-root
Do not disable autoloading for core WordPress options like siteurl, blogname, or active_plugins. Those need to be available immediately on every page load. Target orphaned plugin data, large serialized caches, and settings rows for plugins that are no longer installed. After cleaning up, flush the object cache:
wp cache flush
This forces WordPress to reload the wp_options table on the next request with the updated, smaller autoload set.
Fix 3: Kill Admin-Side AJAX Bloat
Beyond the Heartbeat API, many plugins run their own AJAX calls on admin pages. Analytics scripts phoning home, notification popups polling for updates, plugin licensing checks every few minutes, dashboard widgets loading data asynchronously. These fire even when you are not using those features on that particular admin page.
To catch them, install the Query Monitor plugin and reload any slow admin page. In the Query Monitor panel, click “HTTP API Calls” to see outbound requests your site is making on every page load. Then click “Hooks & Actions” and look for wp_ajax_* hooks with high execution counts.
Common offenders:
- Rank Math and Yoast fetching keyword suggestion data in the background on every post list page
- Freemius-powered plugins checking license status against a remote server every few minutes
- WooCommerce admin analytics loading large sales datasets on the main dashboard
- Gravity Forms and other form plugins polling addon update servers
- Social sharing plugins loading counters from external APIs
For each plugin making unnecessary admin-side calls, check its settings for “background processing,” “usage tracking,” or “remote updates” options and turn them off. If the plugin has no such setting, a developer can add a filter to disable the specific hook, or you can search the plugin’s settings for API call frequency controls.
Fix 4: Delete Post Revisions and Limit Future Ones
WordPress saves a revision every time you click “Update” on a post. A post you have edited 40 times has 40 revision rows in the database, plus the live version, totaling 41 rows for one piece of content. Multiply that by a few hundred posts and you have tens of thousands of rows that slow down every query WordPress runs against the posts table, including the post list screen, the dashboard activity widget, and any plugin that queries posts.
Count your current revisions:
wp post list --post_type='revision' --format=count
If the number is in the thousands, delete them all in one command:
wp post delete $(wp post list --post_type='revision' --format=ids) --force --quiet
Then cap future revisions permanently. Add this to wp-config.php:
define( 'WP_POST_REVISIONS', 3 );
Three revisions is enough to recover from an accidental save while keeping the posts table manageable. You can set it to false to disable revisions entirely, though keeping a small number is a reasonable safety net for sites where authors make frequent edits.
After deleting revisions, run a database optimize to reclaim the freed space:
wp db optimize
Fix 5: Clean Up Expired Transients
Transients are temporary cached values stored in wp_options. They are supposed to expire and get deleted automatically when WordPress next encounters them after their expiry time. In practice, when a site does not use a proper object cache (Redis or Memcached), expired transients pile up in the database and are never cleaned out because the cleanup only happens when someone accesses the expired transient, not on a schedule.
On a site that has been running for two or three years, the transient rows in wp_options can number in the thousands. This adds to the autoload size problem (Fix 2) and also slows down any query that searches or filters the options table.
Check how many transient rows you currently have:
wp db query "SELECT COUNT(*) FROM wp_options WHERE option_name LIKE '_transient_%';" --allow-root
Delete only expired transients (safe to run any time):
wp transient delete --expired
Delete all transients (safe when you have an object cache, or are willing to let plugins regenerate their cached data on next access):
wp transient delete --all
After deleting transients, some plugin settings screens may load slightly slower on first access while the caches rebuild. This is normal and temporary. Within a few minutes of normal site use, the caches will regenerate and everything will be back to normal speed.
If you keep seeing thousands of new transients appearing within days of cleanup, the root fix is adding an object cache (Fix 7 below). With Redis or Memcached in place, transients bypass the database entirely and get stored in memory. The database accumulation problem disappears completely.
Fix 6: Identify and Remove Heavy Admin Plugins
Not all plugins load only on the pages where they are used. Some enqueue large JavaScript bundles, fire database queries, or make remote HTTP calls on every single admin page, including the dashboard, the post list, and settings screens where they have no relevant functionality at all. WordPress provides tools for plugins to limit their asset loading to specific pages, but not all developers use them correctly.
The fastest way to catch these is the Query Monitor plugin. Load a slow admin page with Query Monitor active and look at the “Scripts” and “Styles” panels. Any plugin loading more than 100 KB of minified JavaScript on a page where it does nothing is worth investigating. Then look at the “Queries” panel and filter by component to see which plugins are firing the most database queries.
Common heavy-admin plugins to audit:
- Page builders loading their editor assets on the post list and dashboard (Elementor, Divi, WPBakery all do this to varying degrees)
- Broken Link Checkers running background scans during admin page loads
- Inactive plugins that are installed but not activated (they still get loaded by the plugin loader and can execute code in some configurations)
- Duplicate SEO plugins running simultaneously after a migration (Yoast and Rank Math both active is a common post-migration mistake)
- Admin notification plugins from multiple sources all polling simultaneously
Run this WP-CLI command to get a breakdown of plugin load times during the WordPress bootstrap phase:
wp profile stage --all --orderby=query_time
This shows each plugin’s contribution to total bootstrap time, total queries fired, and cache usage. Plugins at the top of the query_time list are your biggest targets. Deactivate the top offender, reload the admin, and measure the improvement. If the admin is noticeably faster, find a lighter alternative for that feature or go without it entirely.
Fix 7: Switch to PHP 8.2 or PHP 8.3
If your server is running PHP 7.4 or earlier, upgrading to PHP 8.2 is one of the highest-impact changes you can make. PHP 8.x is significantly faster than PHP 7.x for WordPress specifically because of JIT compilation improvements and internal engine optimizations. Most WordPress sites see 20-40% faster admin page loads after upgrading, with zero code changes required on your part.
Check your current PHP version from the command line:
php -v
Or from within WordPress admin, go to Tools > Site Health > Info > Server and look at the PHP version row.
Most managed WordPress hosts (Kinsta, WP Engine, SiteGround, Cloudways, and others) let you change PHP versions from the hosting control panel in under a minute. For cPanel hosts, look under “MultiPHP Manager” or “Select PHP Version” in the Software section.
Before switching on a live site:
- Create a full backup first using your host’s backup tool or a plugin like UpdraftPlus
- Run the PHP Compatibility Checker plugin against your current setup to flag any incompatible code before you switch
- If your host offers a staging environment, test the PHP upgrade there first
- After switching, visit your site front-end, admin panel, and run through your checkout or contact form flow to catch any issues immediately
PHP 8.2 is the current recommended version as of 2026 for maximum plugin compatibility combined with strong performance. PHP 8.3 is available and stable but has slightly less universal plugin compatibility, particularly with older WooCommerce extensions. Start with 8.2 unless you have confirmed all your plugins support 8.3.
Fix 8: Enable an Object Cache with Redis or Memcached
By default, WordPress generates a fresh database connection and re-runs all its standard queries on every single page load. The results of those queries are not stored anywhere between requests. If your dashboard loads and fires 30 database queries, the next admin page load fires those same 30 queries again from scratch. Every page load, every time, every user.
Object caching changes this by storing query results in memory, where they can be retrieved in microseconds instead of milliseconds. WordPress has a built-in object cache API that plugins use when they call wp_cache_get() and wp_cache_set(), but by default this cache only persists for the duration of a single page request. To make it persistent across requests, you install a backend like Redis or Memcached.
This fix has the single biggest impact on admin speed of anything on this list. It reduces database query counts by 50-80% on most sites, eliminates duplicate queries entirely, and speeds up transient reads because they bypass the database completely.
Step 1: Check if Redis is available on your server:
redis-cli ping
If it returns PONG, Redis is running. If the command is not found, ask your host to enable it. Most managed WordPress hosts offer Redis as a one-click add-on in the hosting dashboard. On VPS servers, you can install Redis with apt-get install redis-server (Ubuntu/Debian) or yum install redis (CentOS).
Step 2: Install and activate the Redis Object Cache plugin:
wp plugin install redis-cache --activate
wp redis enable
The second command creates the wp-content/object-cache.php drop-in file that tells WordPress to use Redis as its object cache backend instead of the default in-memory-only system.
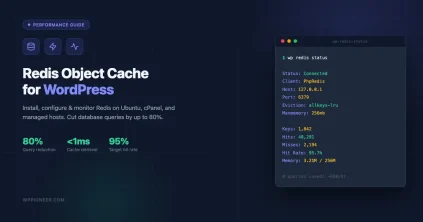
Step 3: Verify it is working:
wp redis status
You should see “Status: Connected” and a hit ratio that climbs above 80% after a few page loads as the cache warms up. A hit ratio below 50% after normal use suggests the cache key TTLs are too short or the Redis memory limit is too small.
If your host uses Memcached instead of Redis, the W3 Total Cache plugin and the Memcached Object Cache drop-in both support it with a similar setup process. Redis is generally preferred because it supports more data types and has better persistence options.
Fix 9: Disable WP-Cron and Use System Cron
WordPress uses a fake cron system called WP-Cron. Instead of running scheduled tasks on a real system schedule, WP-Cron fires on every page load and checks whether any scheduled tasks are due to run. On a busy site this means every admin page load is also running a cron check, and potentially processing queued emails, scheduling scheduled posts, running plugin cleanup jobs, and executing background tasks before it serves the page to you.
Disabling WP-Cron and replacing it with a real system cron job is a two-step process.
Step 1: Disable WP-Cron in wp-config.php:
define( 'DISABLE_WP_CRON', true );
Add this before the “That’s all, stop editing!” line in your wp-config.php file. Once this is set, WordPress will stop triggering cron on page loads. Any scheduled tasks that were pending will wait until the system cron runs.
Step 2: Add a real server cron job:
Connect via SSH and open the crontab editor:
crontab -e
Add this line using WP-CLI (more reliable than calling PHP directly):
*/5 * * * * cd /var/www/html && wp cron event run --due-now > /dev/null 2>&1
Replace /var/www/html with the actual path to your WordPress installation. If you are not sure of the path, run wp config path from the command line to find it.
The */5 * * * * means “every 5 minutes.” This is appropriate for most sites. WooCommerce stores with high order volumes or subscription renewals may benefit from running it every minute (* * * * *).
After setting up the system cron, verify that scheduled events are being registered and running:
wp cron event list
wp cron event run --due-now
The first command shows all scheduled events with their next run time. The second manually triggers any overdue events so you can confirm the cron system is working before the first automatic run.
Fix 10: Profile Every Admin Page with Query Monitor
Query Monitor is a free plugin that gives you a full breakdown of every database query, HTTP call, hook execution, and script/style load for each admin page you visit. It is the closest thing to a server-side APM tool you can run without special server access.
Install and activate it:
wp plugin install query-monitor --activate
Then load your slowest admin pages and work through the panels systematically:
- Queries panel: Total query count and cumulative execution time. More than 50 queries per page load or more than 200ms total query time is a sign something is wrong. Click any individual query to see the exact SQL and the call stack showing which plugin or theme function triggered it. Duplicate queries are highlighted automatically.
- HTTP API Calls: Every outbound request to an external server adds latency to your admin page load, because WordPress waits for the response before continuing. License checks, analytics beacons, plugin update pings. Each one adds 200-800ms if the remote server is slow or unreachable. Any HTTP call on a page where it is not needed is a problem.
- Hooks & Actions: Shows all hooks that fired during the page load with their callback count and execution time. Hooks with dozens of callbacks or with individual callbacks that take more than a few milliseconds are candidates for investigation.
- Scripts & Styles: Every enqueued script and stylesheet with file size and whether it was dequeued. Lets you see exactly which plugins are loading assets on the current page and how large those assets are.
- Environment panel: Shows PHP version, memory limit, and peak memory usage. If peak memory is above 200MB on a simple admin page, you have a leak somewhere.
Query Monitor is safe to leave active indefinitely on a production site. It only shows its output to logged-in administrators, so regular visitors never see it. Use it after any plugin install or major update to check whether the new code is adding overhead to your admin pages before you notice a slowdown.
For command-line profiling without a browser, use WP-CLI:
wp profile hook init --fields=callback,location,time,query_count
The init hook profile is especially useful for finding slow plugin initialization code that runs before anything else on the page.
How to Measure Your Progress After Each Fix
Running fixes without measuring is guesswork. After each change, do a hard reload of the WordPress dashboard (Shift+Cmd+R on Mac, Ctrl+Shift+R on Windows) with your browser’s Network tab open. Look at the “Time” column for the initial HTML document request to wp-admin/index.php. That number is your baseline to beat.
For a more systematic check at the command line, use WP-CLI’s built-in profiler:
wp profile stage bootstrap --fields=time,query_count,cache_ratio
Run this before you start making any changes and save the output. Then run it again after each fix. A healthy WordPress admin site shows:
- Bootstrap time under 300ms
- Fewer than 30 database queries on the dashboard
- Cache ratio above 80% (only achievable with object cache enabled)
- Peak memory usage under 64MB for a standard admin page
If your numbers are significantly worse than these targets after working through all ten fixes, the bottleneck is likely at the server level rather than in WordPress configuration. In that case, check your server’s PHP worker count, look at whether you are on shared hosting with CPU throttling, and consider whether your hosting plan is sized appropriately for your traffic and plugin stack. See our guide on how to speed up your WordPress site for a broader look at hosting-level and front-end performance improvements.
Which Fixes to Prioritize
If you have limited time and want the biggest gains first, tackle these four in order. They address the most universal causes of admin slowness and carry the least risk of breaking anything:
- Enable Redis object cache (Fix 8). Eliminates database redundancy and is the single highest-impact change on most sites. Your host can usually enable Redis in under five minutes.
- Throttle the Heartbeat API (Fix 1). Stops the constant background AJAX polling and is a two-minute install with the Heartbeat Control plugin.
- Upgrade to PHP 8.2 (Fix 7). Free performance from the PHP engine itself, nothing else to configure.
- Audit autoloaded options (Fix 2). A one-time database check that can instantly eliminate megabytes of overhead on every page load.
After those four, run the database cleanup pass (Fixes 4 and 5 together, revisions and transients). Then install Query Monitor (Fix 10) and let it surface any site-specific issues the general fixes did not address. Image optimization also plays a role in overall site speed, so after your admin is running well, take a look at how to compress WordPress images for faster page loads.
The goal is an admin panel that feels fast enough that you stop thinking about it. With object caching, a tuned Heartbeat, clean database tables, and modern PHP, most WordPress sites can get under 500ms on the dashboard without changing hosts, adding hardware, or spending money on new infrastructure.
Beginner WordPress Tips Caching Plugins Essential WordPress settings WordPress Admin Performance WP CLI Commands
Last modified: May 8, 2026


")
")


")

")
")